(available in ![]()
![]()
![]()
![]() )
)
The Sales Analysis Report is another powerful tool to help evaluate the performance of your studio by viewing sales figures broken down in a variety of formats. First, select what type of report you want to generate: general, client group, or session promotion. The report type will determine what filter and grouping options are available to you. Next select a filter or a date range to determine which invoices should be included in the first column of the report. Optionally, you can select a second column of data, which is useful to compare two months, quarters, years, etc. Then select how you want your report to be grouped. Do you want to view sales figures for each photographer, sales person, lead source, promotion, or client group? Then Print Report or Preview Report. For each group, the report will break down the sales figures by the product lines that you have assigned to each item. The Quantity Sold columns simply totals all the quantities for the items that appear in this product line. This number is helpful to compare the number of products sold in a product line versus the total revenue generated for this product line. The Total Sales columns total all the sales for this product line and grouping on the report. The Percentage columns are helpful to compare how each product line and report grouping compare to the overall revenue of the studio.
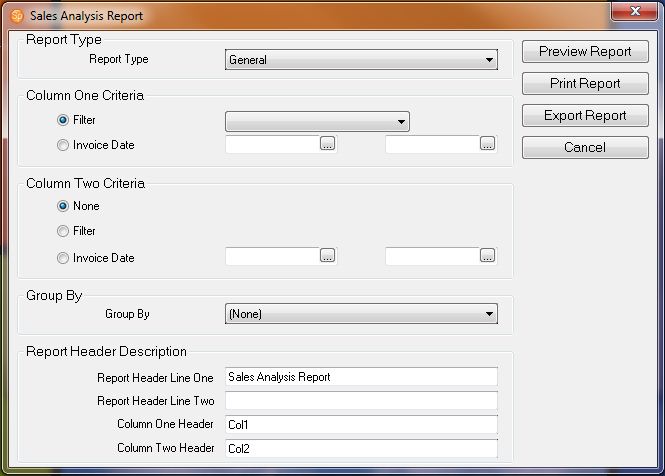
Go to Reports > Analysis Reports > Sales Analysis Report.
Select the Report Type: General, Client Group, or Session Promotion. This will determine what criteria you can select.
Select the Column One Criteria, a Filter or an Invoice Date range.
If you are using a Filter, select a filter you've created, or a client group or session promotion from the drop-down menu.
If you are using an Invoice
Date, select the From
and To dates by clicking  .
.
Next select a Column Two Criteria if you would like to compare two columns of sales. Select a Filter or an Invoice Date range.
Choose how you want to group the report from the Group By drop-down box: Session Type, Photographer, or Lead Source.
Type in or modify the Report Header Description and your two columns.
Click Preview Report to preview the report before you print it.
You can print the report or export it.
Sales Analysis Report
![]()